


How to calculate expected goals for soccer matches
- How to predict the number of goals in a soccer match
- Exploring an expected goal predictive model in detail
- What are the limitations of the expected goal model?

To predict the score of a soccer match successfully, bettors need two things; information and a model. How many goals are scored on average per match? How often does a shot convert into a goal? And most importantly, how can bettors use past data to predict the number of goals in order to place winning bets? This article explains how to use an expected goals model to predict the score in a soccer match. Read on to find out how.
With just 2.73 goals per game on average over the last five full seasons in the Premier League, goals in soccer are a relatively rare event. As popular soccer data book The Numbers Game puts it, up to 50% of any match result can be down to luck, the bounce of the ball or the decision of the referee.
It therefore makes it imperative to use a bigger sample of data for your predictions. So rather than using the 2.73 goals per game in the 2015/16 Premier League for a prediction model, we could use the 8.49 shots on target, or perhaps the 25.7 total shots.
The issue here though is that whilst all goals are worth an equal amount the likelihood of a shot being scored can vary wildly, and this is where expected goals (or 'xG' for short) comes in. On average, a shot in England's top division was converted 9.7% of the time over the last five seasons, but dividing those shots into categories shows just how much the conversion rate can vary.
By looking at historical data we can calculate the average likelihood of each shot being scored by factoring in as many or as few factors as we like. Some in-depth models include whether it was a goal scored with their feet or with their head, the situation that led to the shot and so on. This requires advanced data gathering and statistical analysis skills but it is still possible to gain insight using a far simpler expected goals system. Here I'm going to explain the one I use.
Calculating the value of different types of shots
Let's start with penalties. Between 2011/12 and 2015/16 there were 443 penalties in the Premier League and of those 347 were scored - meaning that on average 78.3% of penalties resulted in a goal. We therefore assign to a penalty an expected goal value of 0.783.
Opta classifies what they consider to be high-quality opportunities as 'big chances,' which they define as "a situation where a player should reasonably be expected to score (usually in a one-on-one scenario or from very close range)."
Over the past five seasons in the English top flight 2,579 of the total of 6,213 big chances have been scored. We have to remember though that penalties are included in these figures, so non-penalty big chances have been converted at a rate of 38.7%, which gives these shots an xG value of 0.387.
Keeping these to one side leaves us with the rest of the shots that are taken in the box. In the last five years, there were 22,822 non-big chances in the box with 1,587 finding the back of the net - giving an average expected goal value of 0.070.
Finally, there are shots taken from outside the box. There were 22,318 such shots in the Premier League between August 2011 and May 2016, and 809 of them were scored, giving on average a 3.6% chance of resulting in a goal. This therefore gives shots from outside the box an expected goal value of 0.036. There will be variation within this, as direct free-kick shots are converted at a rate of around 5-6%, but for a simple system like this the figure of 3.6% will suffice.
How to calculate expected goals per team
This shot data is widely available from various football websites and apps, so armed with the above knowledge you can quickly establish the xG tallies for each team in a match. Looking at matches for this season (up to and including 12th March 2017) shows how this can give you an edge over simple shot data. Of the 211 Premier League matches which were 'won' (when own goals are excluded), the team that had the most shots were victorious in 151 (71.6%) of them, whilst the team that had a higher xG score won on 170 occasions (80.6% of the time).
Using the xG data for the 2016/17 season and the Poisson distribution, I made the following predictions for results and odds for matches in Premier League week 29.
Predicting score based on xG values
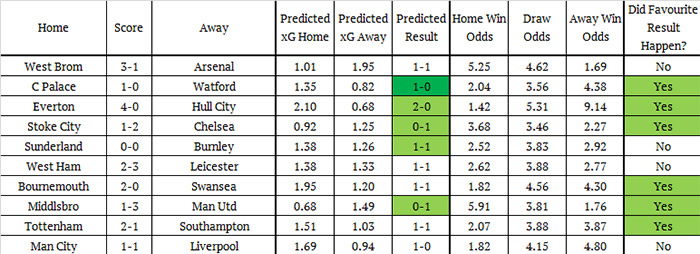
We can see from the 'predicted result' column that there was one correct score and four other result choices (in terms of home win, draw or away win) that were accurate. Using the odds my system calculated, we can see that the favourite 'won' the bet in six of the ten matches, but you would obviously need to compare your odds to those offered by Pinnacle and decide where to bet accordingly.
The limitations of the xG predictive model
It's important to remember the limitations of any model. However good your system may be, it doesn't know that a star striker is out injured, that a club seems rejuvenated following a change of manager, or that a team may be tired after playing in Europe.
A system like this will also fail to predict an especially high scoring game. Since it is based on averages and with around half of matches featuring fewer than 2.5 goals, this is to be expected.
Yet whilst all shots are worth 0.097 goals on average using a simple system like this reveals that Manchester City's shots are currently worth 0.113, whereas Hull's are only worth 0.083.
Using statistical data for expected goals can help you to quantify the quality of a team's defence and attack accurately. Use the above in conjunction with the Poisson distribution and you are on your way to making accurate score predictions for soccer matches.
source: ANDREW BEASLEY / pinnacle.com web
Prosím, ak máte záujem tipovať v pinnaclesports.com, zaregistrujte sa cez tento banner.
